What did we learn from the census?
Key points
- The census suggests the trans population is significantly smaller than Stonewall’s previous estimates
- The questions and guidance designed by the ONS have not succeeded in giving reliable information on either the sex of trans-identified people or their overall number.
- The trans population appear to be strongly resistant to requirements of honesty about their sex, even when that is legally required and the information is treated confidentially.
- Young women are identifying as transgender at a higher rate than women in previous generations, and than the general population.
- Males who identify as trans are five times more likely than other males to be imprisoned for sexual offences.
- Those declaring a transgender identity are less likely than the general population to be victims of murder.
The questions
In 2021 the census for England and Wales included a voluntary question on gender identity for those aged 16 years and over.
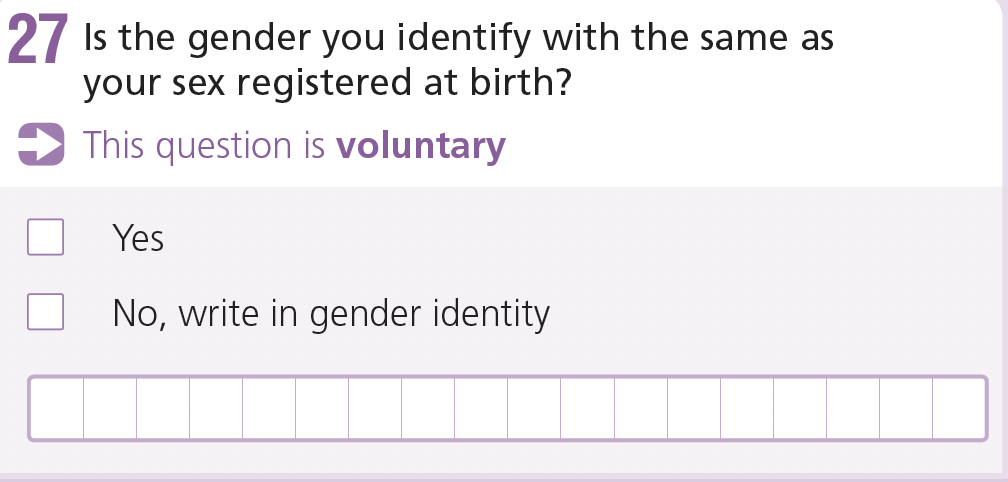
There was also a mandatory sex question which sought to collect information on people’s sex, which was clarified in court by Fair Play for Women as meaning the sex on their birth certificate or gender-recognition certificate (GRC).
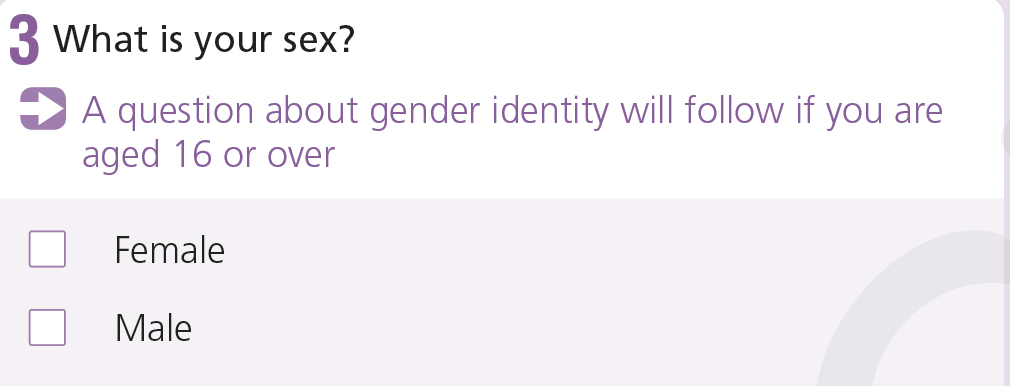
So a trans-identifying man (“trans woman” or transwoman) would answer the sex question as Male, and the gender question as No, then put Female or Woman for gender identity; a trans-identifying woman (“trans man” or transman) would answer sex as Female and gender identity as Male or Man. The only exceptions would be those with a GRC, who could legally answer Male (or Female) for both sex and gender identity, but would still answer No for whether their gender identity was the same as their sex registered at birth.
Unfortunately, those are also the answers that might be given by someone who was not trans but had misunderstood the question and just put their biological sex in both places.
How many people identify as trans?
The ONS released data showing that 96,000 (0.2%) are people it describes as “trans men” or “trans women” (equally split, so 48,000 of each) and 30,000 (0.06%) as “non-binary”.
The headline finding is that 262,000 (0.5%) of the population answered “No” to the question about whether their gender matches their sex at birth. Stonewall has interpreted this as saying that 0.5% of the population “are trans”.
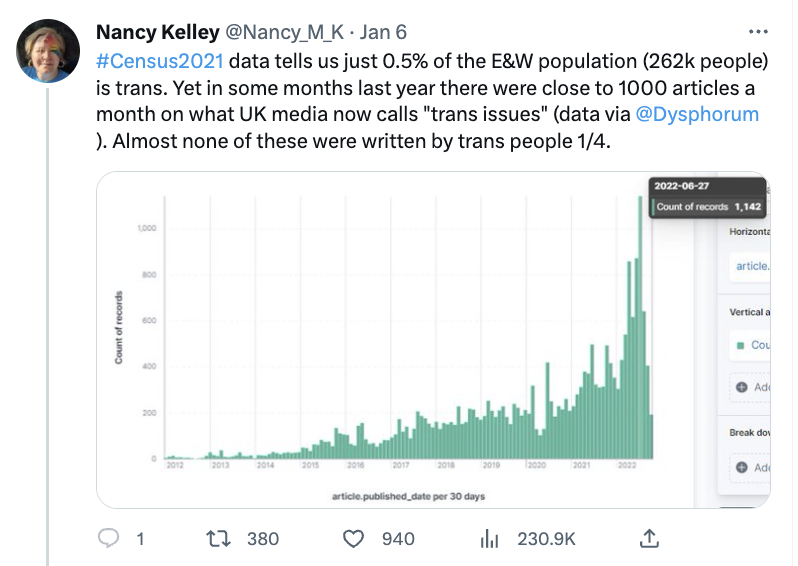
ONS data visualisation expert Clɑiɾe Peɾeiɾa announced the figures as one of the most important charts she had ever made.
![I am so very proud to have put this chart together , to represent the gender identity of people in England and Wales in #Census2021 #gender identity [trans flag] [pride flag] One of the most important charts I've ever made!](https://sex-matters.org/wp-content/uploads/2023/01/Screenshot-2023-01-30-at-19.17.17-741x1024.png)
Gendered Intelligence was quick to follow up with a bid for resources:
“0.5 per cent isn’t a huge number until you think that that’s one in every couple of hundred people in every village, every town… It is undeniable now by any stretch that trans people exist and that we need resources.”
But others noted that the census figures are only around half the previous estimate from Stonewall of 500,000 to 600,000 trans people (across the UK). As Steerpike in the Spectator said:
“Stonewall is a lobbying charity that makes its money by telling big companies and public bodies they need to pay for training to make sure they’re accommodating Britain’s large and growing trans population. Surely it didn’t just invent 300,000 non-existent trans people to support its own lobbying and sales pitch?”
How many people misunderstood the question?
Sex Matters board member Michael Biggs has published a paper looking at anomalies in the data. He says that the headline figures may be high and misleading:
“The geographical concentrations of some of the categories of gender identity are not plausible, especially when compared to sexual orientation. The most likely explanation is that the question on gender was misinterpreted by a non-trivial number of immigrants whose main language was not English.”
Around half of those who ticked “No” to the question about gender identity did not give a specific gender identity. As Biggs notes, there are two possible explanations for this. Either they were confused about the question and were trying to give a negative answer to the concept; or they were indicating that they are transgender but had already used the sex question to state their gender identity instead of their sex. Similarly, it is not clear how many of the people who wrote in “man” or “woman” (which the ONS interpreted as “trans man” and “trans woman”) were also simply men and women who were confused by the question.
As Biggs notes, the areas with the highest apparent proportion of trans people, and of “trans men” and “trans women”, were the London boroughs of Newham and Brent. In contrast, Brighton and Hove – the “queer capital” of Britain – ranks only 21st. You would expect a strong correlation between LGB and T populations by area, but this is a weak one: Luton, for example, ranked 11th in the proportion of transgender people, but 243rd in the proportion of non-heterosexuals.
What Brent, Newham, and Luton have in common is a high proportion of immigrants who are not native speakers of English. It may be that the ONS is counting a significant number of people as trans who did not mean to answer the question in that way at all. In many developing countries, in particular, there remain high rates of non-registration of births, which may make it hard to answer a question about your sex “registered at birth”.
Biggs has called for the ONS to reanalyse the data.
How many did not answer honestly about their sex?
Despite the ONS withdrawing its unlawful guidance, only a minority of trans people appear to have answered with their biological or legal sex – the only correct answer for “trans women” being male, and for “trans men” female, except for those who hold a GRC.
- 31,460 (66%) of those who the ONS identified as “trans women” answered the sex question as female.
- 32,695 (68%) of those who the ONS identified as “trans men” answered the sex question as male.
Taking into account the number of GRCs that have been issued to date (around 6,000 for the UK as a whole), this means that some 63% of those whom the ONS identified as “trans men” or “trans women” must have given the wrong answer to the sex question – or else be people who do not identify as trans and misunderstood the gender question altogether.
Among older people whom the ONS classifies as trans men and trans women, the proportion answering the sex question by stating the opposite sex rose from 60% to over 80%.
It is an offence to give incorrect answers to the census.
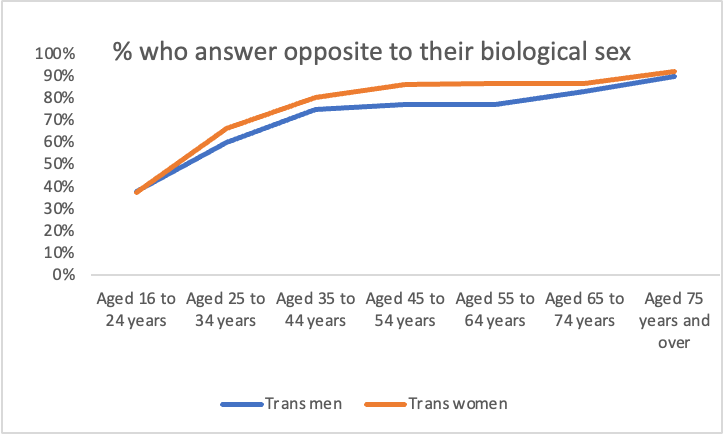
It may be that a significant proportion of those who answered that they are male (trans) men and female (trans) women misunderstood the question and are not trans-identified at all.
The ONS should release all of the gender-identity and sexual-orientation data on a sex-disaggregated basis (for example by local area and by health, education and other outcomes).
The lack of clarity of the results show why the ONS’s insouciant insistence that sex is an “umbrella concept” was a dereliction of its duty.
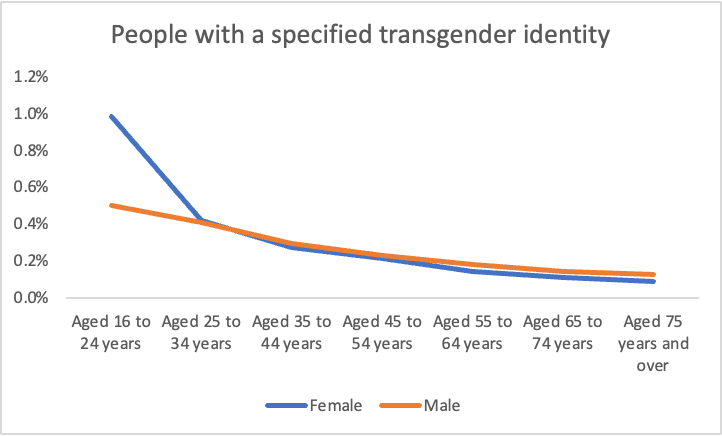
Young women appear to be identifying as trans at a much higher rate
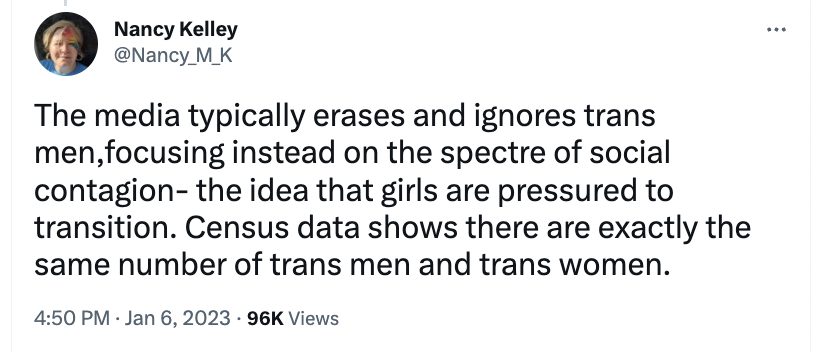
Nancy Kelley dismissed the idea of social contagion affecting young women, saying the census data shows there are “exactly the same number of trans men and trans women”.
However, the age and sex breakdown tells a different story. Taking the data at face value, “trans women” are slightly more common in every age group apart from ages 16 to 24, where there are significantly more “trans men” and people identifying as “non-binary” in the the younger age group. More of those identifying as non-binary or other genders are female.

Overall, looking at all of those who give a specific gender identity and correcting for sex (that is, counting “trans men” as female and “trans women” as male), the trans-identifying population tends to skew towards the younger age group, with a particularly large increase in trans-identifying females in the youngest cohort. Young women identify as trans at more than double the rate of the general population.
Comparing with the prison population
Mar Vickers and Wings over Scotland have published comparisons of the census data with figures on men and women in prison for sex offences. In March 2021, there were 11,660 men and 103 women, plus 92 “trans women”, in prison in England and Wales for sex offences.
- 11,660 men out of a population of 29.5 million = 1 in 2,530 men serving time for sex offences.
- 103 women out of 30.4 million = 1 in 295,000 women serving time for sex offences.
- 92 transwomen out of 48,000 = 1 in 522 transwomen serving time for sex offences.
That suggests that men who identify as “trans women” are five times more likely than other men, and 566 times more likely than women, to commit sexual offences.
If the numbers of “trans women” goes down further through recalculation, this proportion will rise.
Comparing with the BBC
Professor Alice Sullivan compares the census figures on people who identify as LGB or T with the numbers working at the BBC. Eight percent of people at the BBC say they are LGB, compared with three percent in the census. Two percent of BBC staff are trans, a share eight times higher than the total of “trans men”, “trans women” and non-binary people in the census.
This suggests there is little need for diversity efforts at the BBC to focus on increasing the number of LGB or trans staff.
Comparing with murder rates
Sullivan also compares the identified trans population with murder rates. During the ten-year period between 2013 and 2022, only four homicides were recorded in this group. During the same period 7,118 homicides were recorded in the UK, combining data for England and Wales, Scotland and Northern Ireland. This suggests that murders of trans people were 0.056 percent of all murders.
This is ten times less than the general population murder rate if we take the high-end census estimate for the number of trans people (including all those who did not give a gender identity) or five times less if we only look at those who specified a gender identity.
| Further releases of data will be made, including: • gender identity by ethnicity and religion • sexual orientation and gender identity, a cross-analysis • gender identity: health and disability • gender identity: educational attainment • gender identity: employment and labour market outcomes • gender identity: family and household circumstances • gender identity: housing. |
These data should be released in sex-disaggregated categories.
Update 28th February 2023: We asked the ONS for a breakdown of the written answers to the gender identity question and it said:
“We are considering a piece of work that will be published involving the coding index for the gender identity question. This work is ongoing and we require the time and space to plan for and develop a formal publication with the appropriate accompanying context and commentary to maximise public understanding of the data, ensure the information is formatted and presented appropriately, and to apply any necessary disclosure controls to the information.”
We look forward to seeing this analysis.