The taming of the doggit
A tiny dog is not, in fact, a rabbit.

This post is based on a twitter thread by Sex Matters’ Director Dr Emma Hilton (@FondofBeetles).
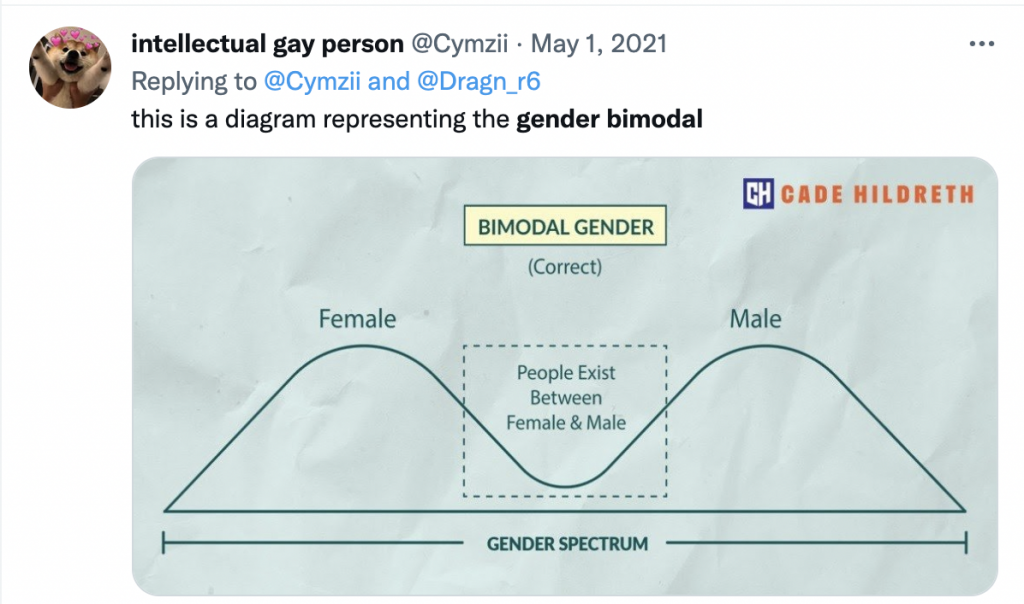
It responds to the common (but nonsensical) argument that sex is “bimodal” and therefore that sex is not binary but in fact a spectrum.
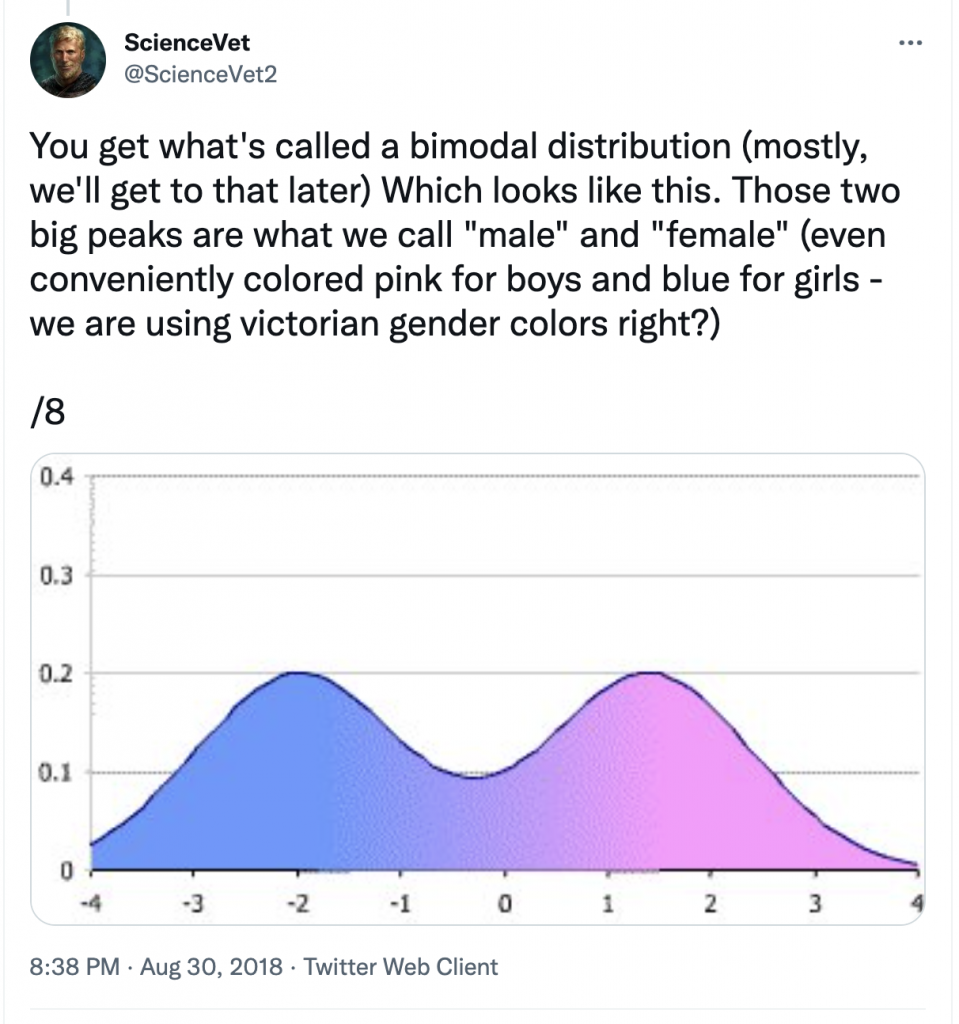
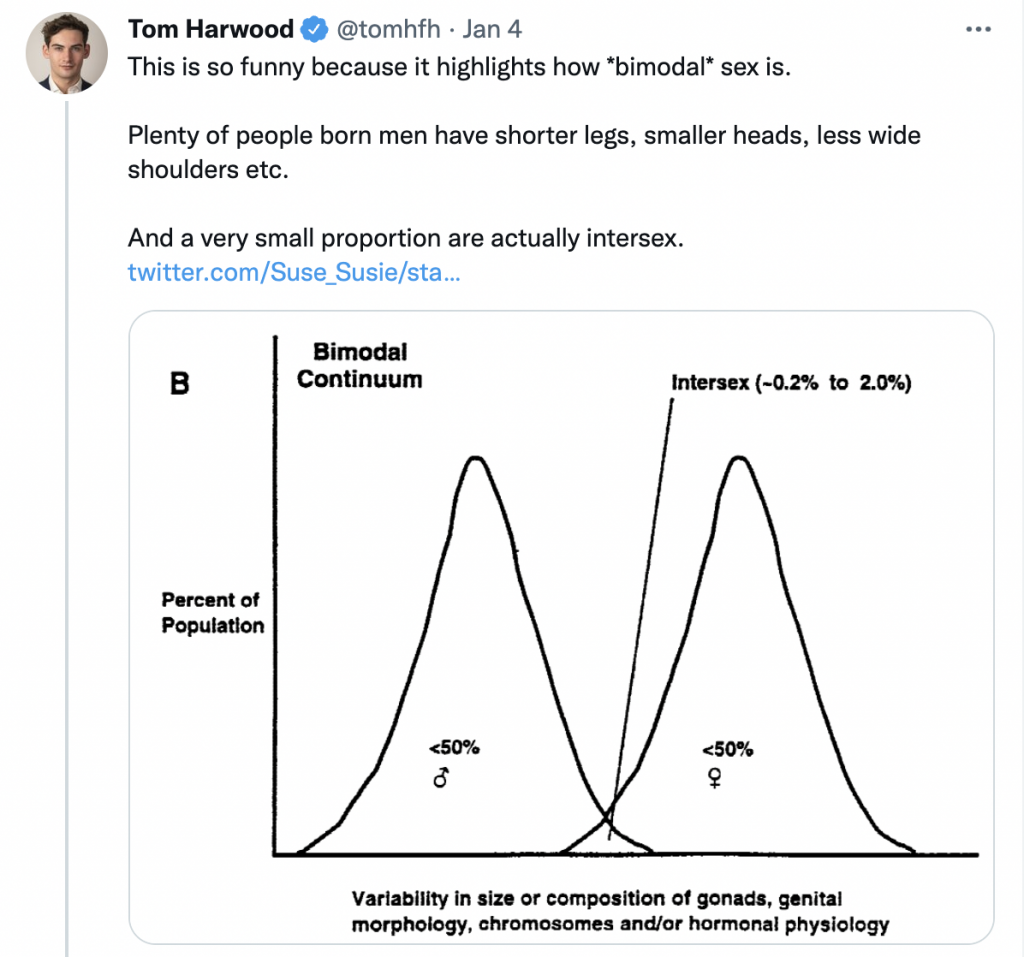
The graph you have posted clearly shows two overlapping normal distributions. Each normal distribution is associated with either the female sex or the male sex.
Short males are not female. Yet a very short male may appear in the little area of overlap highlighted, because they are at the far right of the male normal distribution, not because they are magically ‘intersex’ or ‘a bit female’.
The X axis in the graph is not ‘sex units’. The graph is not mapping sex. It is schematically mapping a characteristic associated with sex, like testosterone levels (in some concentration unit). Sex is why you have a bimodal distribution of testosterone levels.
It is not even clear how you would put chromosomes on the X axis as there is no intrinsic order to a dataset like XX, XY, XO, XYY etc.
When you put together data about two discrete populations that have an average difference in a characteristic, you will get a graph with two humps. The reason why the graph of sex characteristics is bimodal is because you are measuring two discrete populations!
Measure the body length of 1000 domestic rabbits and 1000 domestic dogs.
Plot them as length distributions.
A tiny dog may well be within the ‘rabbit length’ range.
A tiny dog is not, in fact, a rabbit. You are not mapping a dog-rabbit species spectrum.
You are mapping a variable characteristic (body length) in two discrete populations (dogs and rabbits), where said characteristic may, at the more extreme converging ends of each individual distribution, overlap in value.
If you choose to present both of those distributions on the same graph, perhaps to compare them, you don’t suddenly eradicate the very first premise that you have collated the data from two discrete populations.
In fact, it’s deeper than that.
Say you don’t know you are collecting data from two discrete populations – that is, you were given a dataset called ‘body length of domestic pets’ with 2000 entries.
If you plot all those body lengths and identify a bimodal distribution, the very first question you should be asking is: am I looking at data from two different types of pet?
If you see a trimodal distribution, maybe you’ve got goldfish data in there.
Dr Emma Hilton
Thanks to @moleatthedoor at for the illustration of the dog-rabbit species spectrum, and to Tom Harwood for prompting the Twitter thread.